Eskom-calendar was an open source project I created and maintained for ~2 years until (thankfully) its raison d’être ceased to be. At its peak, it had 60k downloads per week and received national media recognition. Oh, and it’s written in Rust, btw.

The problem
Imagine this: You’re going about your daily life when suddenly, your power goes out. Not because of a fault or emergency, but because it’s scheduled to happen. This is loadshedding - South Africa’s solution to prevent the entire national power grid from collapsing due to insufficient electricity supply.
Eskom (the national power utility) divides each day into blocks where different areas take turns going without electricity. There are multiple “stages” of loadshedding, from Stage 1 (least severe) to Stage 8 (most severe). As the stages increase, the frequency and duration of power cuts increase. At Stage 6, which is common, an area might have no power for 4.5 hours at a time, multiple times per day.
On top of this, the national power utility is hopelessly disorganised and the schedules announcing when your power will be cut off are only available in literally one of hundreds of PDF documents. There is no API. There are no CSVs. There might be an inconsistently formatted Excel spreadsheet, if you’re lucky. Oh, and did I mention that the only way official announcements are made is via screenshots on Twitter? These are not once-a-month announcements. These are “the entire schedule has changed” announcements, made every 3 days.
As you might imagine, it’s nigh impossible to organise your life around this. You don’t know if you’ll be able to cook a warm dinner when you get home. South African’s don’t have a gas line into their homes, so you can’t use a gas stove to cook. You don’t know if your internet will go down in the middle of an important video meeting. Even if you have power, your ISP might not have power in which case you’re also out of luck. Your laundry is going mouldy because you can’t find enough time to let the laundry-machine finish. You milk is going bad within two days because the grocery store can’t keep it refrigerated all the time.
The solution
This is where eskom-calendar becomes crucial. It helps people:
- Know exactly when their power will be off based on their specific area
- Plan their daily activities around guaranteed power times
- Get notifications before power cuts so they can prepare (charge devices, cook meals, etc.)
- Automate systems (like backup power) based on the schedule
- Share accurate schedule information with employees, clients, or family members
Without tools like eskom-calendar, people would need to manually check complex schedules and calculate their power cut times - a time-consuming and error-prone process that becomes especially difficult when stages change frequently. The package essentially turns a complex, frustrating system into manageable, actionable information that helps people maintain some normalcy in their daily lives despite the challenges of loadshedding.
Technical details (because it’s kinda neat)
I’m pretty happy with how Eskom-calendar worked under the hood. I was a poor college student at the time, this was explicitly a zero-income project, and it might end up running for years. I needed something with zero running costs, and this requirement lead to some… interesting business choices that lead to actually interesting technical choices.
How Eskom announces loadshedding
Yes, that is a tweet with an image of a PDF of a table. This is the only way to access the information in that table. There is no API, there are no CSVs, there is no Excel spreadsheet download. Only a tweet of an image of a PDF of a table.
How Eskom implemented loadshedding is politically motivated which makes it technically complicated. Basically, Eskom itself does not declare “everyone living in suburb Foobar, your power will be off from 5pm to 7pm today”, because Eskom is a national institution and merely sells power to the municipalities, which in turn sell power to everyday people. Because of this decoupling, what actually happens is:
- Eskom forecasts that there will be more demand for electricity than they can supply
- Eskom publishes a tweet announcing that the country will move from stage 0 (no loadshedding) to stage 4 (heavy loadshedding) from 5pm to 7pm this evening.
- Individual municipalities are then in charge of converting “stage 4” to “your power will be off from 5pm to 6pm if you live in this suburb”.
- In practice, this meant each municipality published massive PDFs of tables filled with tiny writing describing which areas would be affected by loadshedding at which times and on which dates.
This decoupling directly lead to a massive amount of confusion, as Eskom would change the loadshedding stage approximately every three days (due to incompetent management and political tomfoolery). Every time the stage changed, literally everyone in the country would have to cross reference the new stage with what their municipality published.
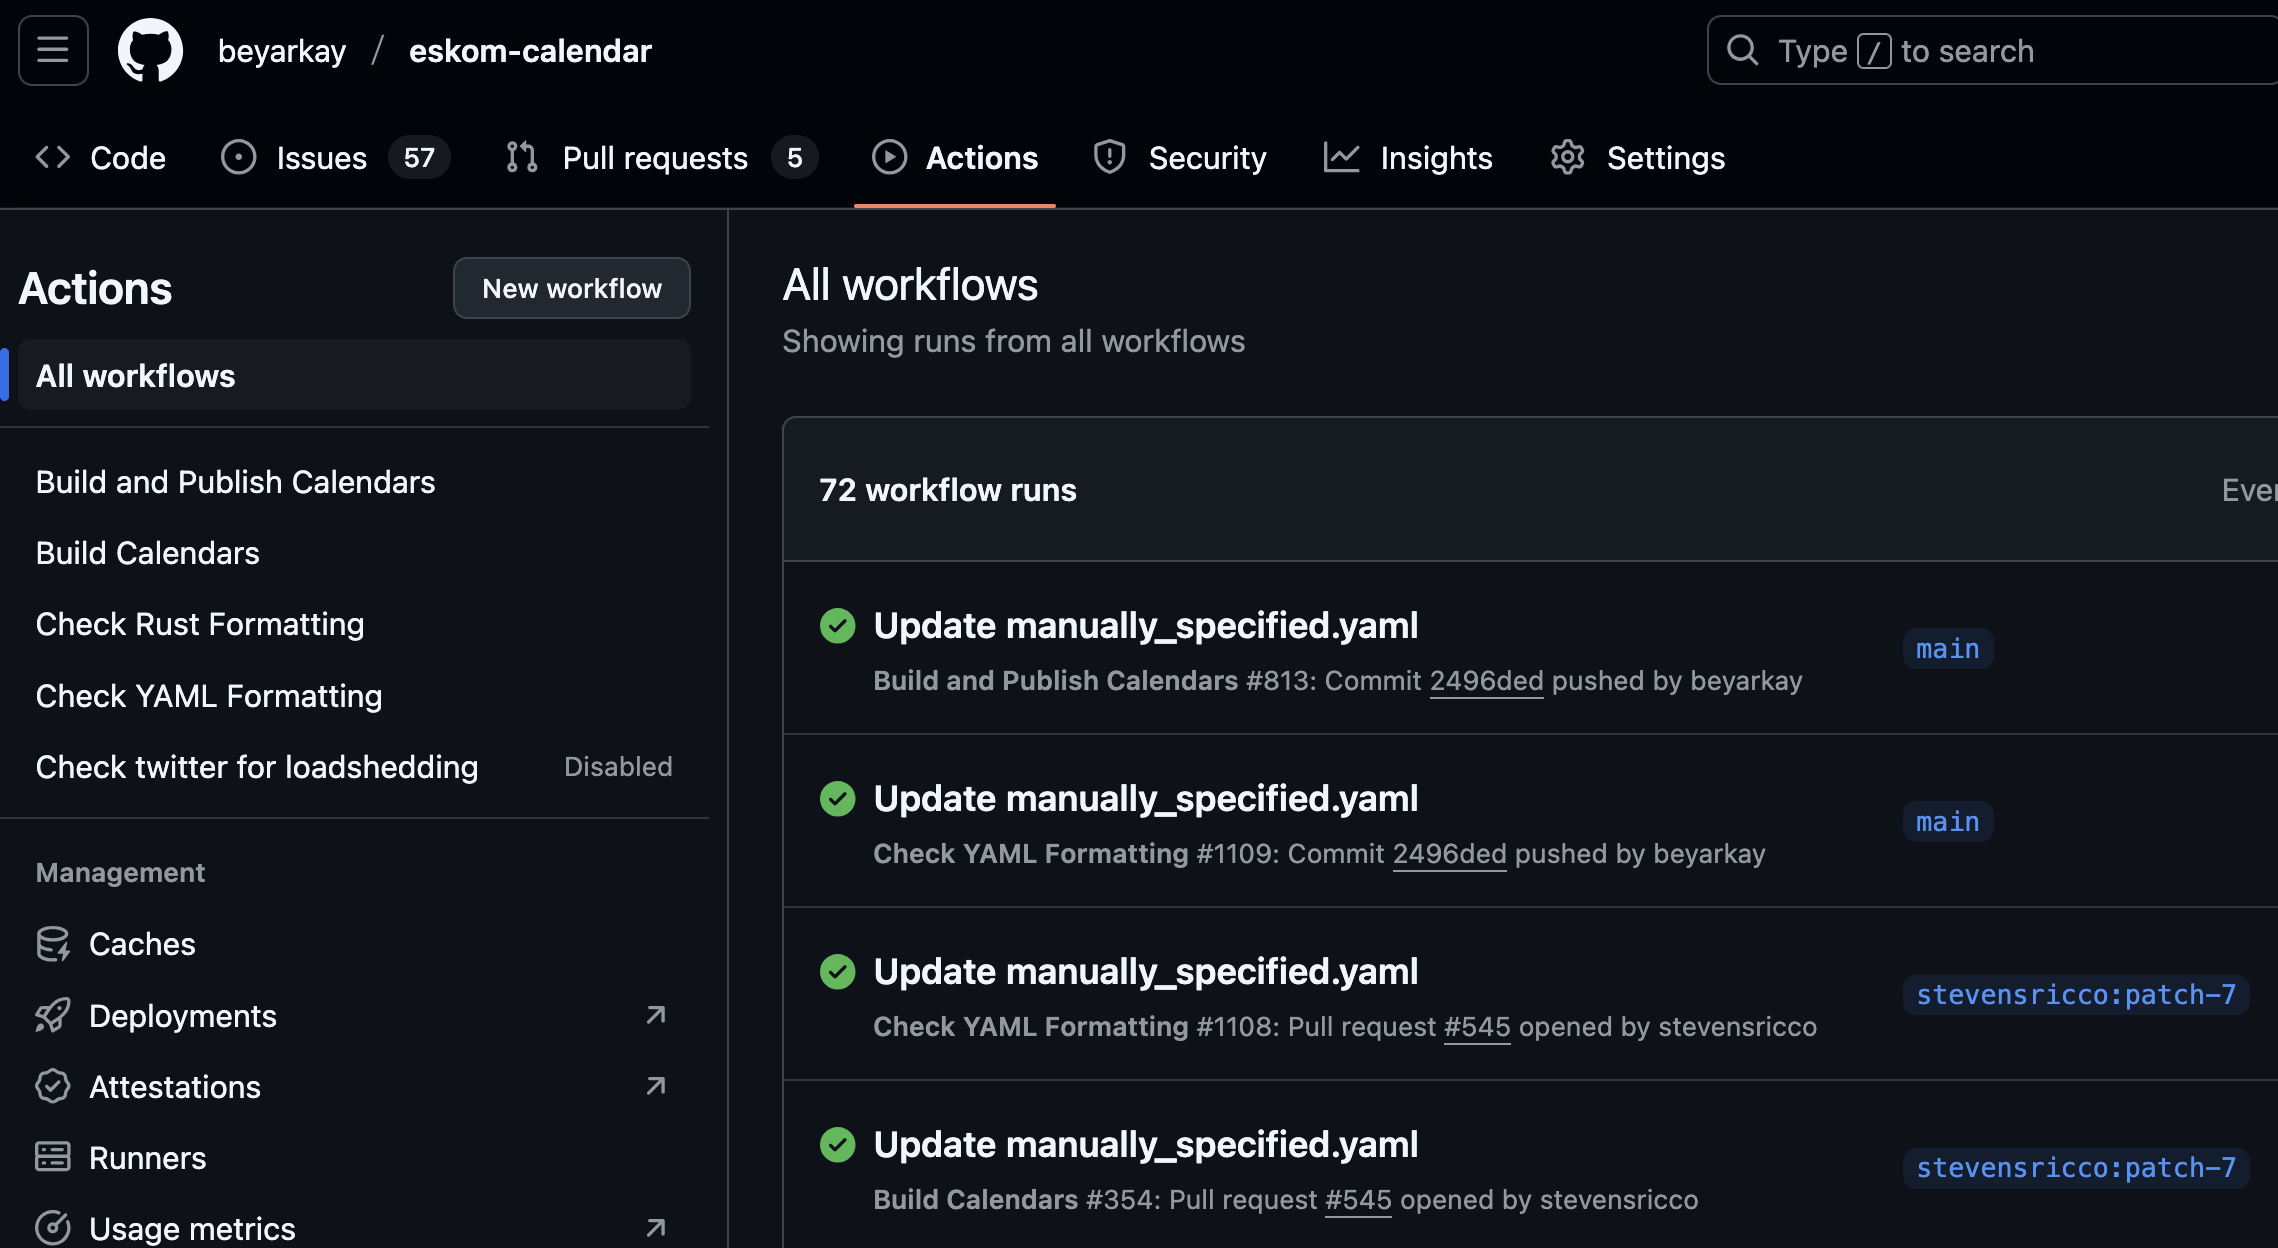
Automatic updating via GitHub actions
From the start, I wanted to use internet calendar subscriptions. This started as a personal project, and I wanted to view power outages in my calendar alongside my meetings, plans, and whatnot. This way, I’d be able to schedule around loadshedding without having to open a different app or manually parse dates like “Monday 08:00-10:30 Stage 1, Tuesday 10:00-12:30 Stage 2, Tuesday 18:00-20:30 Stage 1” into something that I could cross reference against my calendar.
A few things came together to make this project work nicely:
- The Internet Calendar spec (RFC5545) is plain text, making it incredibly easy to work with and understand.
- All calendar apps (Apple Calendar, Outlook, Google Calendar) allow you to “subscribe” to a calendar by providing a URL. The calendar app will then query that URL at some frequency1 and display the updated list of events to the user.
- GitHub has a “Releases” feature which allows you to upload ~arbitrary files and host them at a consistent URL.
- GitHub also provides GitHub Actions which allows you to do ~arbitrary work on their machines, optionally triggered by ~arbitrary events.
All of this means that once I wrote code to ingest a schedule and output .ics
files, I could use GitHub Actions to create those .ics files from the input
schedule and GitHub Releases to host the calendars. Then the user just has to
copy the GitHub Releases URL, paste it into their calendar app, and they’ve got
up-to-date loadshedding information for life. And I (a poor college student)
don’t pay a cent.
Unseen complexity
Ah but we’re not done yet. Having code to create an .ics file from a
JSON or YAML file that describes the schedule is easy.
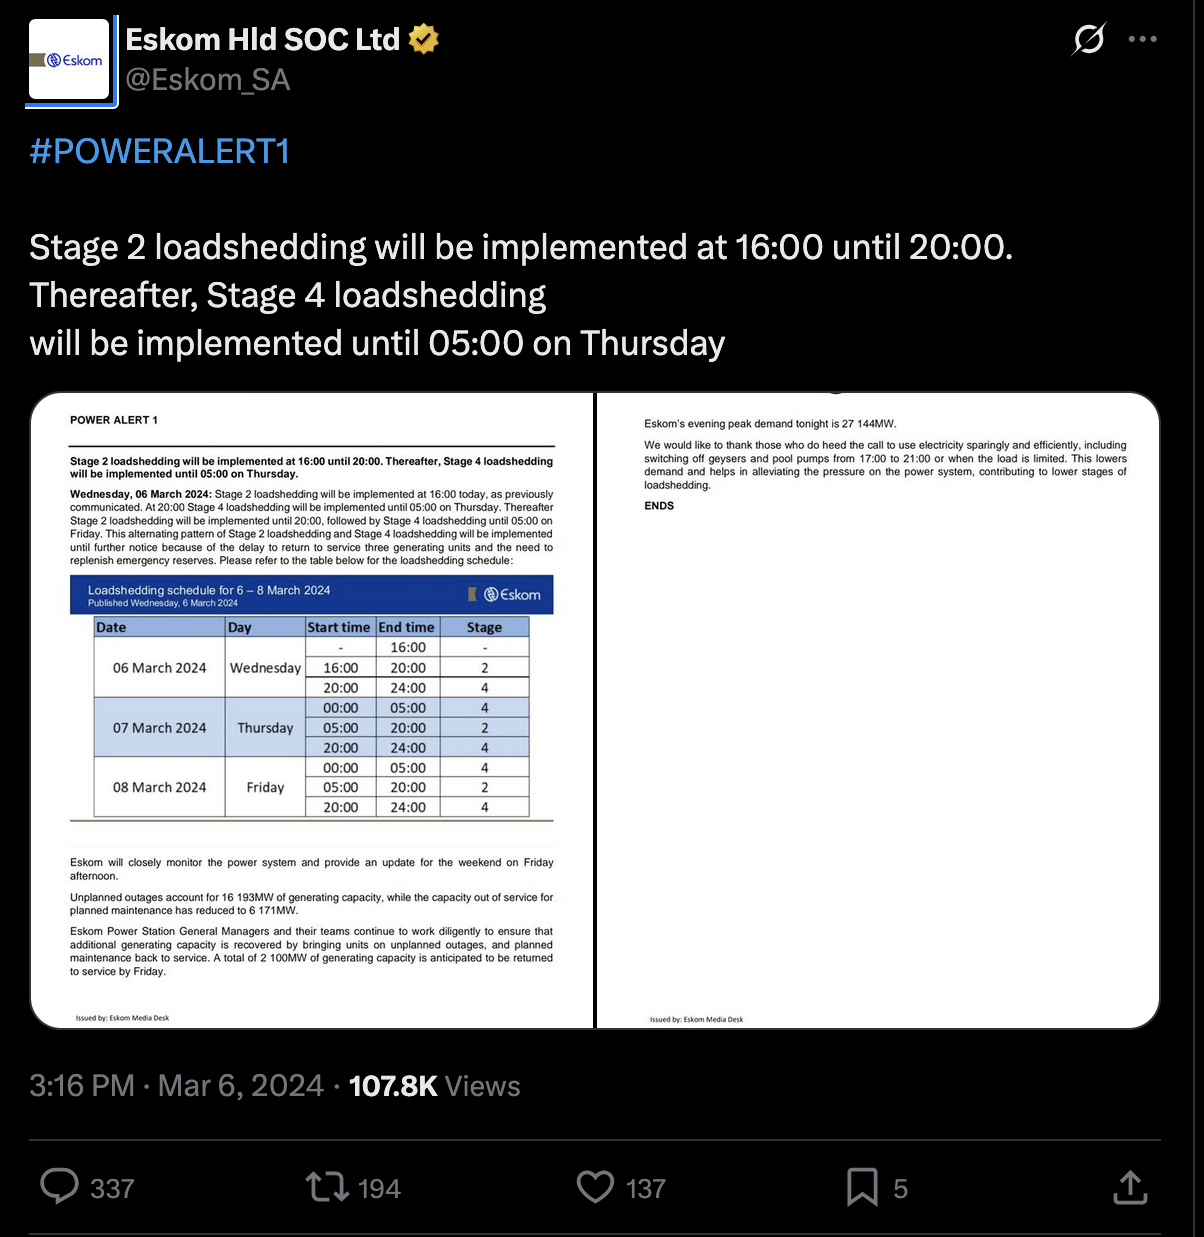
The problem is, there is no single schedule. There are two schedules, and we’re interested in the intersection between them. Specifically, there’s the announcements that Eskom publishes via twitter, saying something like this tweet:
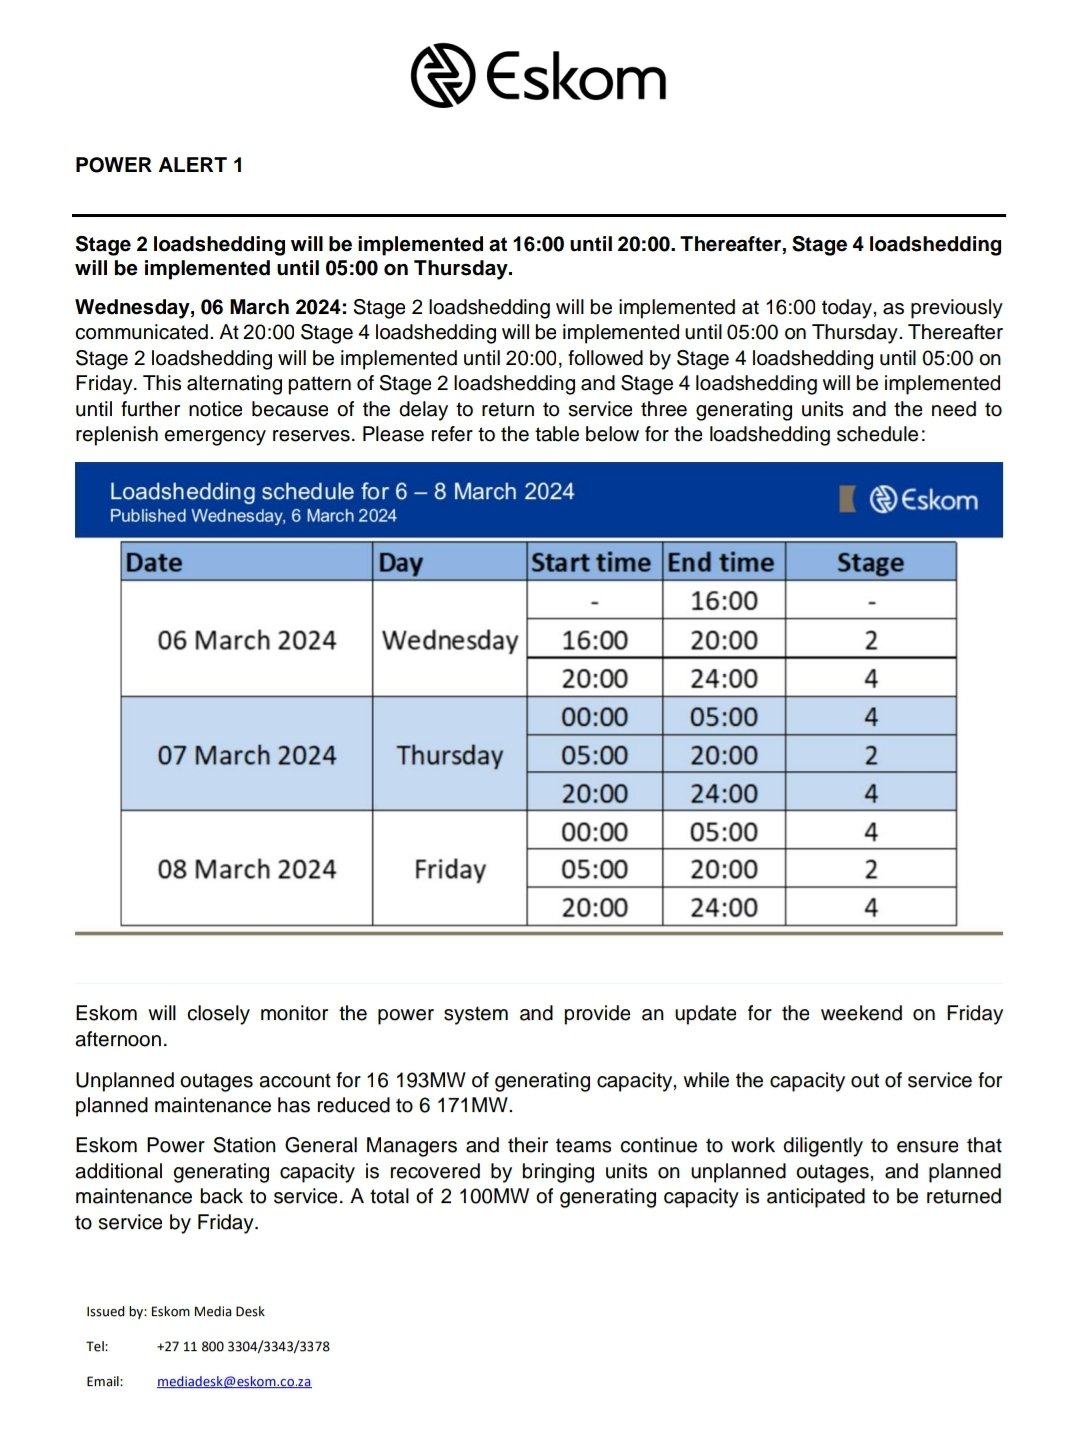
(If it looks painfully bureaucratic, that’s because it is).
I would manually2 parse this image into a machine-understandable form like (truncated):
changes:
    - stage: 2
    start: 2024-03-06T16:00:00
    finsh: 2024-03-06T20:00:00
    source: https://twitter.com/Eskom_SA/status/1765365800251125890
    exclude: coct
    - stage: 4
    start: 2024-03-06T20:00:00
    finsh: 2024-03-07T05:00:00
    source: https://twitter.com/Eskom_SA/status/1765365800251125890
    exclude: coct
...
This list of changes3 is not where the party ends, however. Because this
just tells you that you’ll be in “stage X” at this and that time. It doesn’t
tell you when your damn lights will be out. To convert a list of changes
into a list of power outages, we’ll need to get information from the
municipalities about what “stage X” means for any given region.
There’s an API for that, right?
Oh no? Well, there’s like, a CSV file, right?
Oh also no? But there’s an Excel spreadsheet or something, right? right?
In actual fact, there’s about 700 individual regions in South Africa, and almost all of them have slightly different loadshedding schedules that map stages onto hours during a day without power. Each municipality (there are many municipalities in South Africa) handles this slightly differently:
- Some schedules repeat every week. Some repeat every month. Some repeat every 10 days. Some repeat every 19 days (I have no idea why 19 is special).
- Some municipalities have Excel spreadsheets, some have PDFs, some have PDFs that contain screenshots of Excel spreadsheets. Eskom themselves handle a few special loadshedding areas, in which case you have to download their excel spreadsheet and use Excel macros and formulae to select your region, the stage, and then view your area’s schedules.
- There is no consistent ID schema to identify the different areas in South Africa. Each place has a name, but because history, some places have multiple names, some have legacy names, and some are in the process of changing their names. And of course, many places have the same name.
So I went through these 700 different regions and converted them to CSV files, looking something like:
date_of_month ,start_time ,finsh_time ,stage
            1 ,00:00      ,02:30      ,    2
            1 ,00:00      ,02:30      ,    3
            1 ,00:00      ,02:30      ,    4
            1 ,00:00      ,02:30      ,    5
...
or (for weekly repetitions):
day_of_week ,start_time ,finsh_time ,stage
          1 ,18:00      ,20:00      ,    7
          1 ,18:00      ,20:00      ,    8
...
or (for weird repetitions):
day_of_cycle ,period_of_cycle ,start_of_cycle ,start_time ,finsh_time ,stage
           1 ,             19 ,2023-09-15     ,06:00      ,08:30      ,    2
           1 ,             19 ,2023-09-15     ,06:00      ,08:30      ,    3
           1 ,             19 ,2023-09-15     ,06:00      ,08:30      ,    4
           1 ,             19 ,2023-09-15     ,06:00      ,08:30      ,    5
           1 ,             19 ,2023-09-15     ,06:00      ,08:30      ,    6
...
These CSV files and the YAML file can then be combined to find the intersection
of the two: if there’s a change saying stage 1 from 08:00 to 11:00, and your
area has loadshedding today at stage 1 from 09:00 to 11:30, then your power
will be off from 09:00 to 11:00. Yes, there were lots of weird edge cases to
figure out here.
Using rust in production
This, honestly, was one of the best ideas I made. I just used rust because I wanted to use rust, but once the code compiled it was solid. I don’t think it ever broke on me for a reason that wasn’t a logic bug. Paired with enough tests to ensure the logic is working, I felt incredibly confident in the code I wrote. Absolutely would recommend. As an aside, there’s a non-trivial amount of work to be done in order to read ~700 CSV files, find the intersections, and then write ~700 ICS files. Rust gobbles these files up like a champ. This isn’t exactly a time-sensitive matter, but it’s really nice knowing you’re not waiting for a slow language.
Footnotes
-
Annoyingly, Google calendar’s frequency is anywhere between 0 and 48 hours. This caused problems during the busy periods when Eskom was updating their schedules more than once a day, as users would have out-of-date information. ↩
-
“but why didn’t you automate this” LLMs are good, but even they can’t deal with inherent ambiguity. Many times, Eskom would announce an incomplete or incoherent schedule (ie “Stage 1 10:00 to 12:00, stage 2 11:30 to 12:30”). In which case I end up DM’ing some folks to try get them to sort their stuff out. There is no API. There is no automatically-updated file. I am the API. I am the one providing the automatically-updated file. ↩
-
Naming these objects
changeswas incredibly confusing, but it was part of the public API and I didn’t realise it was a bad idea until it was too late to change without breaking other people’s code.announcementswould have been a better word for what they are. ↩