This mini-project was inspired by this tweet:
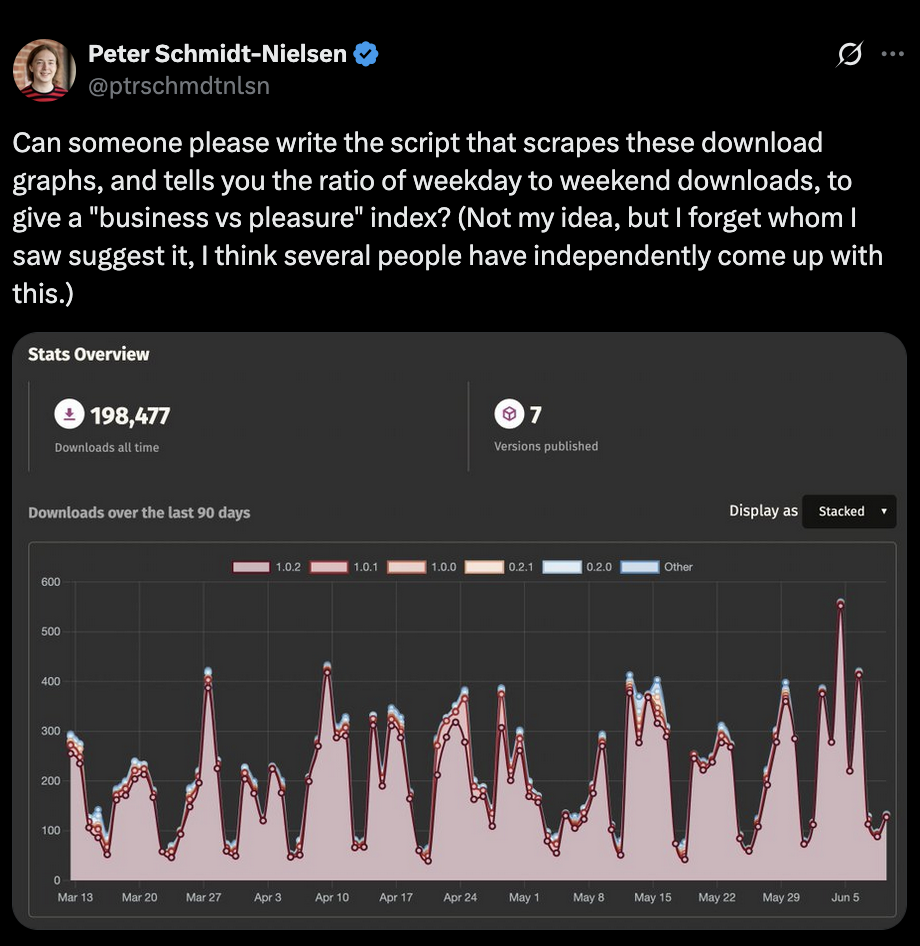
After which I spent about two hours making a small script that grabs data from
the rust package repository crates.io, and analyses the data to see which
crates are downloaded mostly on the weekends (indicating they’re being used for
hobby projects) or mostly on the weekdays (e.g. mostly for work).
And you can run it right now using uv:
uv run https://gist.githubusercontent.com/beyarkay/6e752756f71b3a84f44af42a964cc399/raw/main.py serde tokio anyhowWhich will give you this output:
Crate            Week    Weekend Business÷Pleasure
--------------------------------------------------
tokio        40358216    6136704 2.67
anyhow       43630626    6789537 2.61
serde        63175072   11452723 2.24
This means that tokio was downloaded 2.67x more on weekdays than on weekends
(and yes, it accounts for there being 2.5x more weekdays than there are
weekends).
Downloading the top 1000 crates’ metadata
With some help from ChatGPT, I got this bash command to download the top 1000 most downloaded crates, extract their names, and then pass them through the script, so we can see which crates are most used for hobby projects:
for p in {1..10}; do
  curl -s "https://crates.io/api/v1/crates?page=${p}&per_page=100&sort=downloads" \
    -H "User-Agent: Script for https://gist.github.com/beyarkay/6e752756f71b3a84f44af42a964cc399" \
    | jq -r '.crates[].id'
  sleep 1
done | xargs uv run https://gist.githubusercontent.com/beyarkay/6e752756f71b3a84f44af42a964cc399/raw/main.py
This command will take about 10m to download all the crates’ metadata. If you instead just want to get the top 100 crates, you can also just use this script:
curl -s 'https://crates.io/api/v1/crates?page=1&per_page=100&sort=downloads' \
    | jq -r '.crates[].id' \
    | xargs uv run https://gist.githubusercontent.com/beyarkay/6e752756f71b3a84f44af42a964cc399/raw/main.py
EDIT(2025-06-19): someone from
crates.iohas pointed me to their [API usage policies7. A previous version of this post did not set the user agent of any queries and did not sleep between requests. That’s my fault, I should have checked and not abused the good graces of the open internet. I will do better in the future and any future experiments will use the DB, not the API.
You can download the full 1000 crates as a CSV here.
Most downloaded crates during the week
| Crate | Description | Week Downloads | Weekend Downloads | Business÷Pleasure |
|---|---|---|---|---|
| jsonschema | JSON schema validaton library | 6 329 667 | 246 262 | 10.44 |
| retain_mut | Provide retain_mut method that has the same functionality as retain but gives mutable borrow to the predicate. | 2 730 719 | 114 647 | 9.68 |
| fraction | Lossless fractions and decimals; drop-in float replacement | 5 943 813 | 258 175 | 9.35 |
| jsonpath-rust | The library provides the basic functionality to find the set of the data according to the filtering query. | 7 820 463 | 354 292 | 8.97 |
| metrics-util | Helper types/functions used by the metrics ecosystem. | 5 696 846 | 261 035 | 8.87 |
I’d never heard of jsonschema before, but I’m not surprised that schema
validation of the most popular serialisation format in the world is downloaded
the most during the week vs the weekend. The crates.io download graph really
accentuates this:
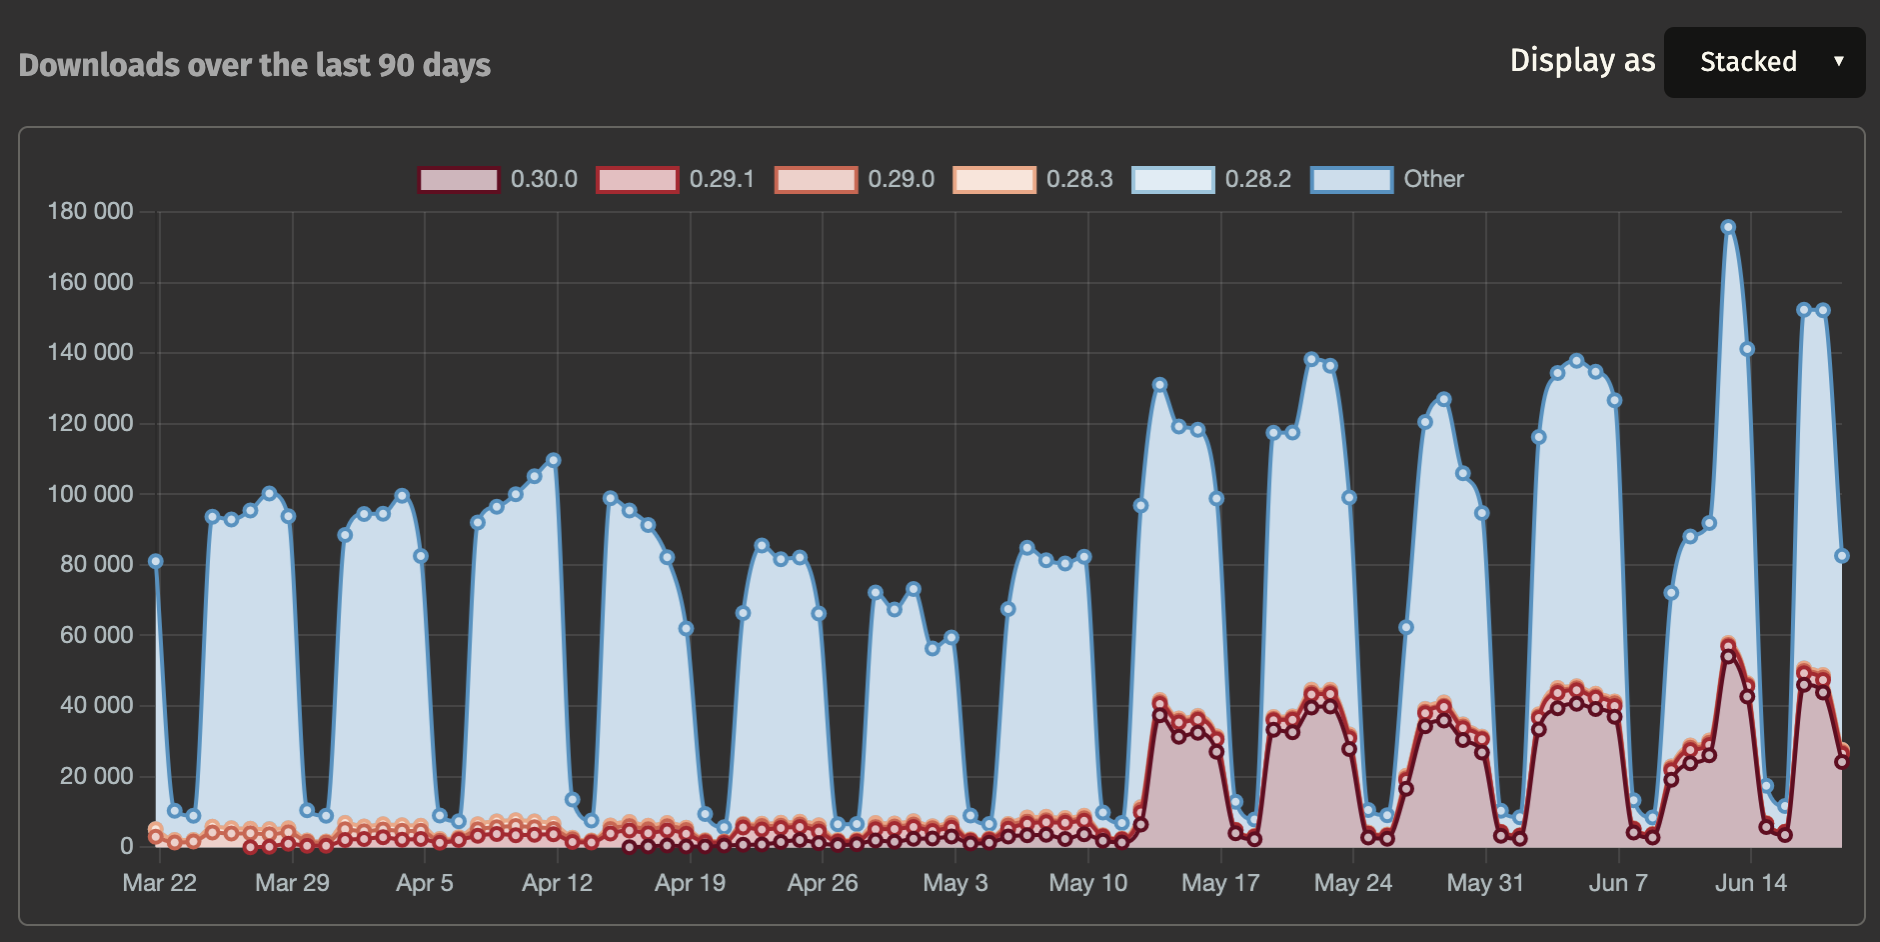
So spiky! Basically nobody downloads jsonschema during the weekend.
I’m kinda surprised by the appearance of fraction here, my only guess might
be that there’s a lot of academics or scientific computing work being done in
rust? I’m not sure how precise fractions help increase revenue or decrease
costs. I’m sure someone will let me know in an angry reddit comment. The rest
of the crates seem to be mostly utilities or tweaks to existing features.
Least downloaded crates during the week
| Crate | Description | Week Downloads | Weekend Downloads | Business÷Pleasure |
|---|---|---|---|---|
| proc-macro-nested | Support for nested proc-macro-hack invocations | 316 396 | 75 467 | 1.70 |
| difference | A Rust text diffing and assertion library. | 1 209 375 | 255 015 | 1.93 |
| version-compare | Rust library to easily compare version numbers with no specific format, and test against various comparison operators. | 3 213 640 | 656 467 | 1.99 |
| net2 | Extensions to the standard library’s networking types as proposed in RFC 1158. | 1 628 494 | 330 474 | 2.00 |
| iovec | Portable buffer type for scatter/gather I/O operations | 1 697 529 | 331 185 | 2.08 |
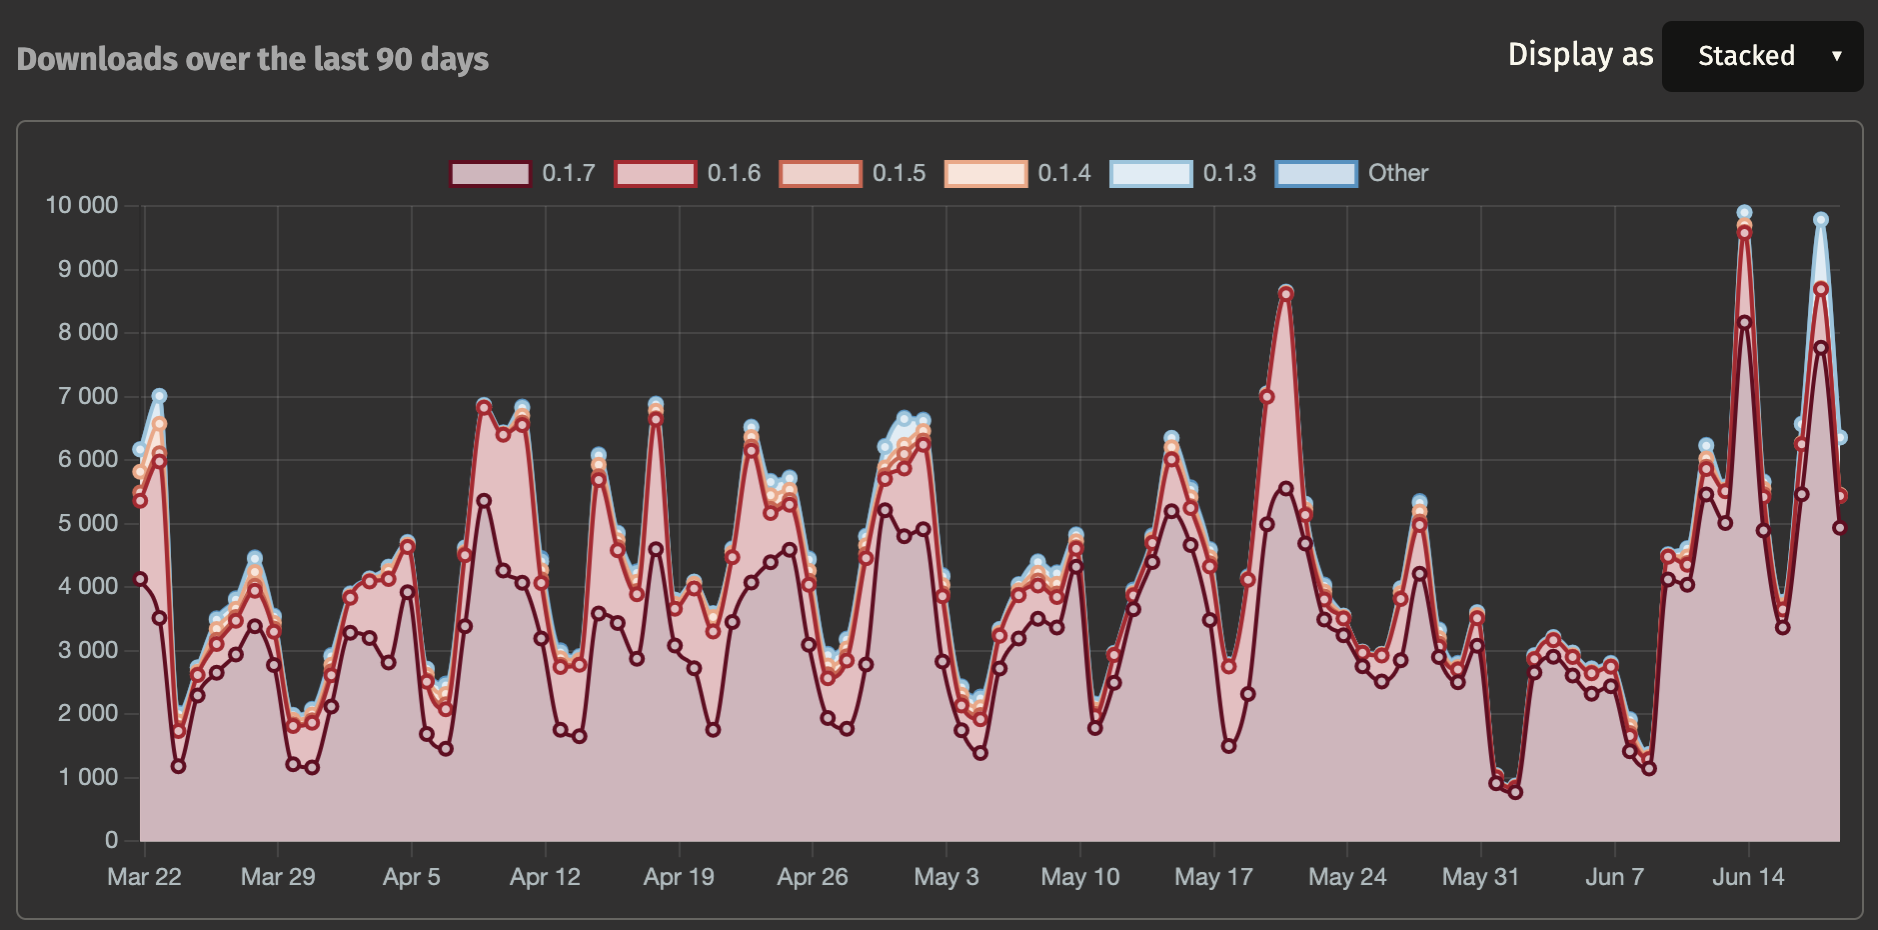
It seems like the hobbyists like proc-macro hackery! (or more likely, proc-macro-nested just has very very few downloads). Here’s the crates.io graph of downloads over time, you can see it’s still spiky but much less emphasised towards the weekends. It also doesn’t have that many absolute downloads (none of the least-downloaded-crates-during-the-week do) so it’s likely that a few power-users can skew these data.
Plots and graphs
We can have a look at the distribution of the ratios for the top 1000 crates:
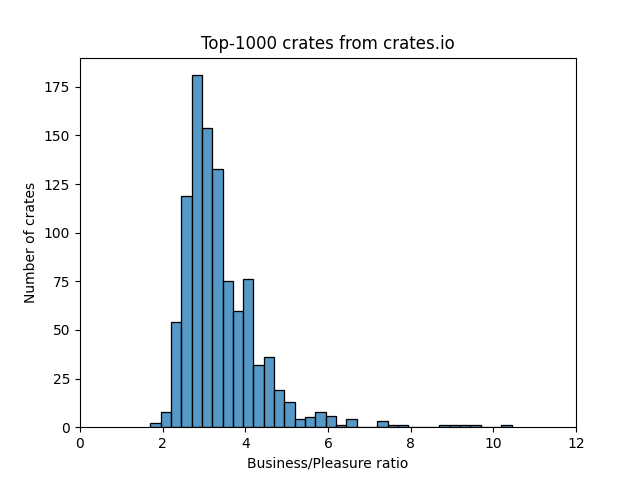
It’s a very tight band, barely any crate with any significant number of downloads has more than 5x or less than 2x the number of downloads on weekdays vs weekends. This is also visible from the statistics, the standard deviation is just 0.93:
mean        3.39
std         0.93
min         1.70
25%         2.79
50%         3.16
75%         3.76
max        10.44
Here are the weekend vs weekday downloads for the top 1000 crates, the green line indicates the point at which a crate was downloaded equally on the weekend and on a weekday:
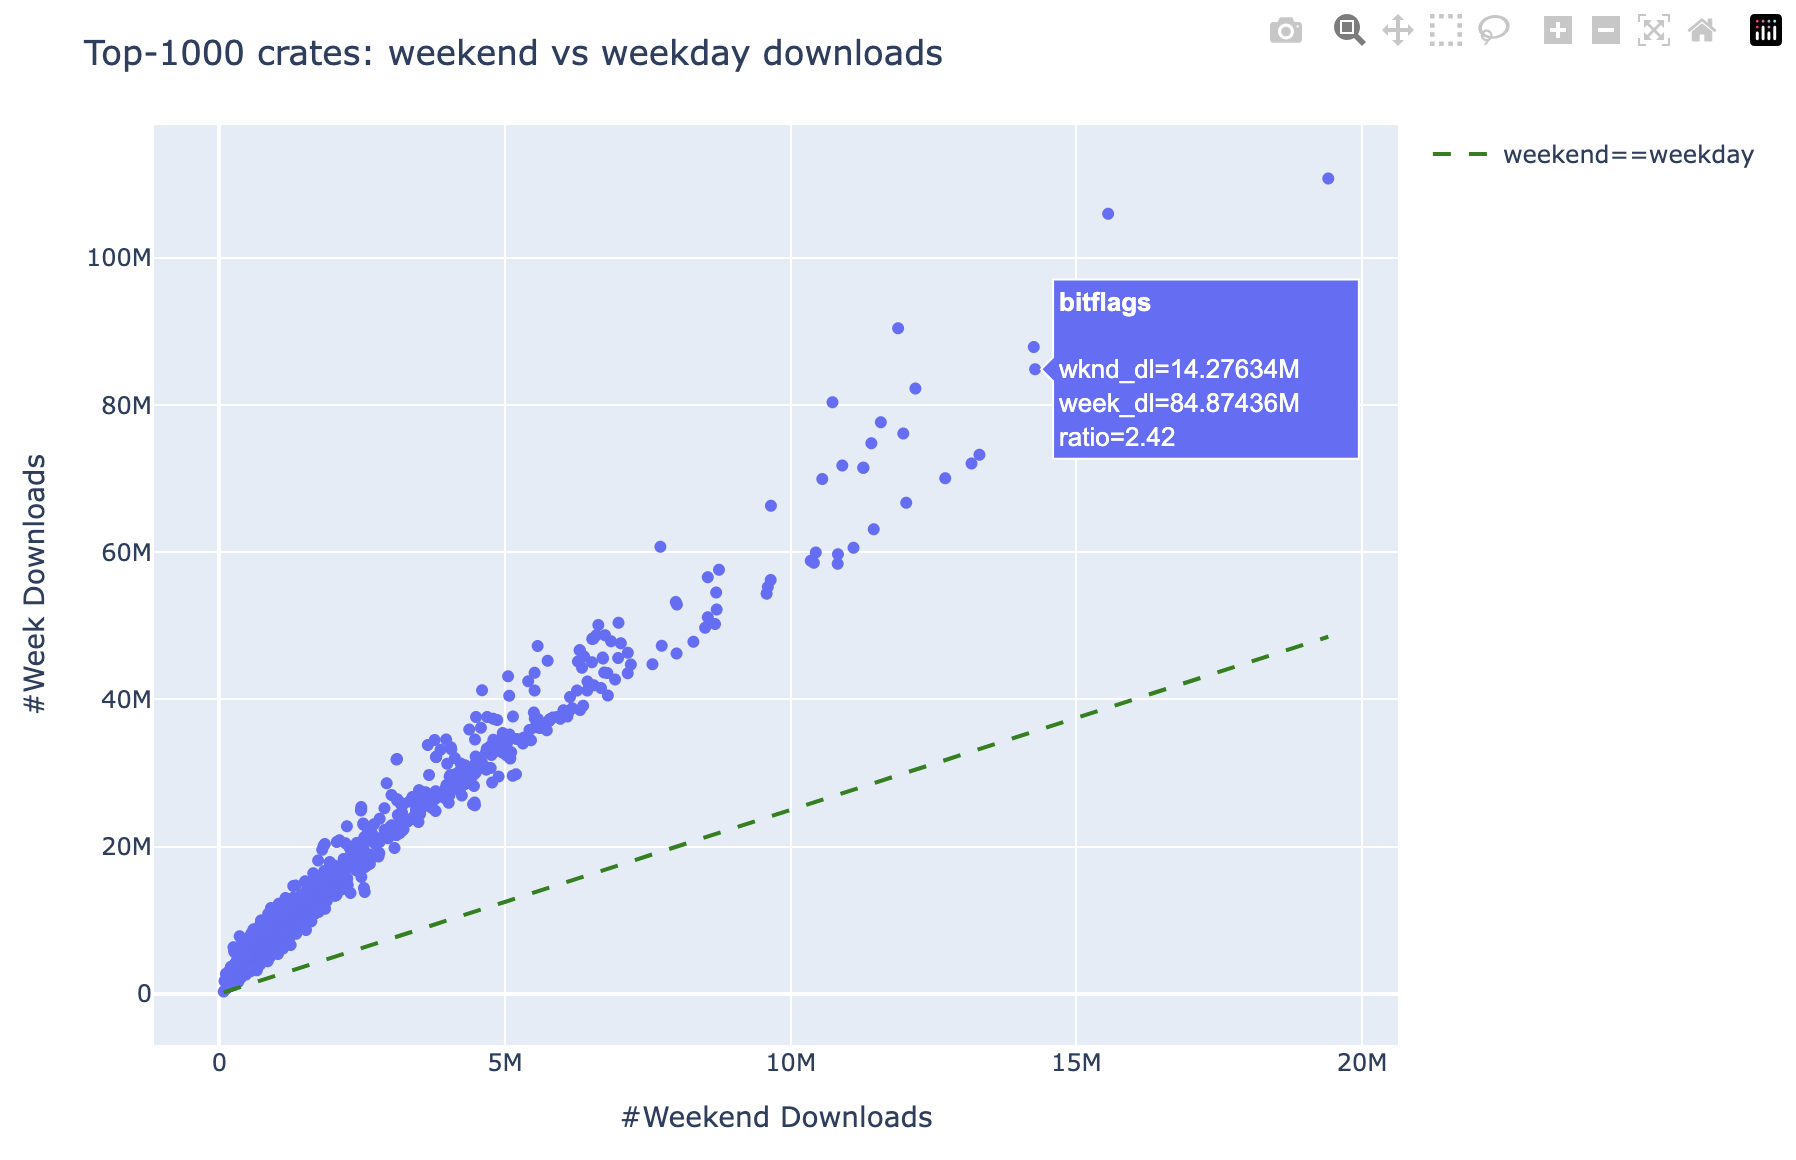 You can also play around with an interactive version of this graph
here (you might have to hit “refresh”
after you click the link).
You can also play around with an interactive version of this graph
here (you might have to hit “refresh”
after you click the link).
It’s interesting to see a slight curve to the points, indicating that crates seem to get lots of adoption during the week, but then later in life they turn to be more downloaded on the weekends. That’s the opposite of what I expected! I was expecting the smaller crates to be discovered by hobbyists and then gradually trickle into business use-cases.
Building it
Given we’re in the age of AI and I can’t be bothered to fight with writing a web scaper (most of the time), I leant heavily on ChatGPT or to do the heavy lifting.
After some digging around1 the first query was sent at 20:35 on Monday June 9th 2025 and the last substantial change to the script was around 21:10, so 40m to get ChatGPT to produce something I liked. A lot of that time was adding some nice-to-haves, the initial script produced by ChatGPT was functionally perfect. Some things I wanted to add:
- help text if the user doesn’t give any CLI arts
- progress bar while the crate metadata is downloading (each crate’s metadata takes about 1.5s to download).
- Coloured output because why not
- sorting the crates in order of the Business÷Pleasure ratio
- removing some weird formatting that ChatGPT put in there
Overall, you probably could have just had a pipe from tweet to ChatGPT to gist and it would have been fine. Kinda crazy how far LLMs have come.
After messing about a bit with recording a showcase video, uploading the
script as a gist, and figuring out how to run a gist via uv, I posted my
reply with the instructions for how to run it.
Final Thoughts
That was fun! Quick project, in-and-out. I really like how LLMs let me do quick things like this more easily and with less effort. None of the above was difficult for me before, but just kinda painful and not my idea of a fun time. But LLMs let me cut through the boring stuff to get to the interesting bits. Hopefully this trend continues.
If you like data science and graphs of interesting data, you’ll love looking at the data I managed to scrape from TiKTok.
Discuss this project on:
- r/programming (525 upvotes, 266 comments)
- r/rust (72 upvotes, 10 comments)
- lobste.rs (17 upvotes, 13 comments)
Footnotes
-
For some unknown reason, the ChatGPT UI doesn’t give datetimes for messages, but it’s present in the JSON network response so I could get the datetime in the end ↩